Final Project Proposal by Maya Pruitt

EXPLORING DATA GATHERING AND DATA VISUALIZATION

Based on my undergrad Thesis - Beyond Seeing: Differences Between Experts and Novices in Observational Drawing

I collected A LOT of data, and different kinds:

  • videos of the drawings themselves

  • in-process screenshots

  • audio files of the participants’ thought processes

  • transcriptions of said audio files

  • image difference statistics

  • time (for total drawing , to map objects)

Example of word data. These are different phrases from the transcriptions categorized by a topic of my choosing with expert or novice status indicated.

Example of word data. These are different phrases from the transcriptions categorized by a topic of my choosing with expert or novice status indicated.

Can I visualize this word data? Can I improving upon the presentation of common phrases/repeated words/similarities in thought processes?

After presenting my ideas in class, I was encouraged to start with counting the frequency of certain words. I like this suggestion, but my hesitation is that I had already done word counts for this project and found the results were not very revealing. Data visualizations like word clouds can definitely demonstrate word frequency but don’t really tell you the relationship between words, which if I’m trying to present the inner thought processes of my participants, this might not be very illuminating.

BUT it is a good way to start. Maybe I can add and interactive element where rolling over a word can show you actual phrases of the participants? Or the fact that it is a comparison between expert and novice may add more interest

word cloud.jpg
Cloud-1.jpg

What I would ideally like to do is a second experiment….or at least set myself up for a second experiment. For part two, I would like to look at how Expert & Novices might view art differently.

Prediction: Expert are more likely to imagine how an artwork would have been made and visualize the process

I thought an interesting way to do this would be to use EYE TRACKING! → Would like to have people look at artworks, & log their eye movements onto a sort of map….I think the outcomes for the two groups may look very different and would be fun to compare

However, feedback in class seemed less enthused about this…so maybe its not a good idea or there isn’t enough time.

Who's it for?

Myself and anyone interested in the mind of artists drawing from observation

How will people experience it?

Visually seeing data instead of reading a 75 page thesis.

Is it interactive?

Possibly.

Is it practical? Is it for fun? Is it emotional?

It is practical, hopefully the visualization presents information clearly.

Is it to provoke something?

Educate more than provoke. My hope would be to communicate a topic I feel passionate about in an interesting way that makes people consider the effects of skill learning in the arts.

RETURN TO HOW DO ARTISTS THINK?

PComp Final Proposal by Maya Pruitt

Group: Working with Dylan Dawkins and Cara Neel

IDEA: AN UNDERWATER WORLD!

Using projections, we want to transform ideally any corner of the room into an underwater escape room experience.

Quick sketches by Cara to illustrate our initial vision

Quick sketches by Cara to illustrate our initial vision

After talking with David about this, we realized that world building is a pretty huge undertaking. We needed to decide whether the user is meant to simple explore it or if they are a character in a narrative. To help frame the world, we fused these concepts together, creating a story that guides the user through exploration in our world, and then to escape it!

Here is a link to our initial storyboard.

Thinking through the technical aspects and interactions: we thought about gesture capture or building some sort of remote control but we ultimately decided that the main physical interactions would be created with pressure plate switches on the floor and wall (linked to an Arduino). The Arduino would then communicate with Unity to build the 3D modeled world to be projected

IMG_2759.JPG

PURPOSE: We want to create an experience that alters perception, and changes the way you expect a surface to act. We want to heighten physicality by allowing the user to walk around and engage with the world with their hands and feet. It is an opportunity for people to reflect how their presence affects space, while playing a surreal game.

Next steps:

-playing around with projections

-building the Unity world

-creating plate switches to trigger changes to the projection

RETURN TO DEEP DIVE

PCOMP FINAL BRAINSTORM by Maya Pruitt

For this post, I’m just going to hash out some ideas for the physical computing final.

Our assignment is to make an “interactive system”, meaning we should think about it as a feedback loop. Instead of having just one interaction (user input, to device output), can it create two-way communication?

IDEAS:

  1. Not sure if this can be turned into an interactive system, but I like the idea of revisiting my undergraduate thesis. I have actually submitted an IRB for a second experiment to jump off the original thesis. Using eye-tracking, my advisor and I were interested in understanding how art training affects the way humans look at art. It would be super cool to create this eye-tracking device that paints. What I mean is that I predict, that expert artist often view art imagining the process and how they would create it themselves. I predict that a representation of their eye movements might look different than people who don’t have art training.

    • The result would be different “drawings” that represent the eye movements. Perhaps different colors for each part (are the looking at the edges of something, the middle.

    • Since I also used protocol analysis, this technique could be used again but this time something is taking the dictation as it happens. Maybe certain words trigger a different output.

    • Perhaps this is too ambitious and I could table this for my thesis, or maybe it’s a combination of ICM and PCOMP? I don’t know, but I think it could be interesting, and I would love to have ITP collab with the Cognitive Science department at Vassar somehow.

  2. I just really want to create a giant projection of water on the floor and I want people to be able to move the water with their hands, or touch a fish. Is this even PComp idk?

  3. Maybe I can expand on beat visualization and make it an entire room installation. Could delve into the world of the psychological phenomenon of synesthesia – associating colors or smells to different sounds.

  4. Mental health has really been on my mind lately. I don’t really know how to incorporate that, but it would be very meaningful to me to crate a device that provides comfort to those who are struggling. There is a lot of stigma around mental health perhaps because humans are so judgemental, maybe if you talk to a machine that can take away that fear? or maybe it makes one more uncomfortable? Would love to expand of this somehow: Sit in a chair that warms to provide comfort.

  5. Giant interactive rube goldberg machine

PCOMP MIDTERM PART II: FABRICATION by Maya Pruitt

See below for more about the process.

The first halloween midterm post was getting a bit long, so I wanted to break it up into a second post, but also as a way to distinguish that creating the Halloween disco ball was truly a balance of two major components: the programing of digital elements AND the fabrication of the physical parts. Without the former, it is an empty shell, and without the latter, it is a bunch of LEDs and wires. So we thought critically about the fabrication of our project as well.

IMG_2888.JPG

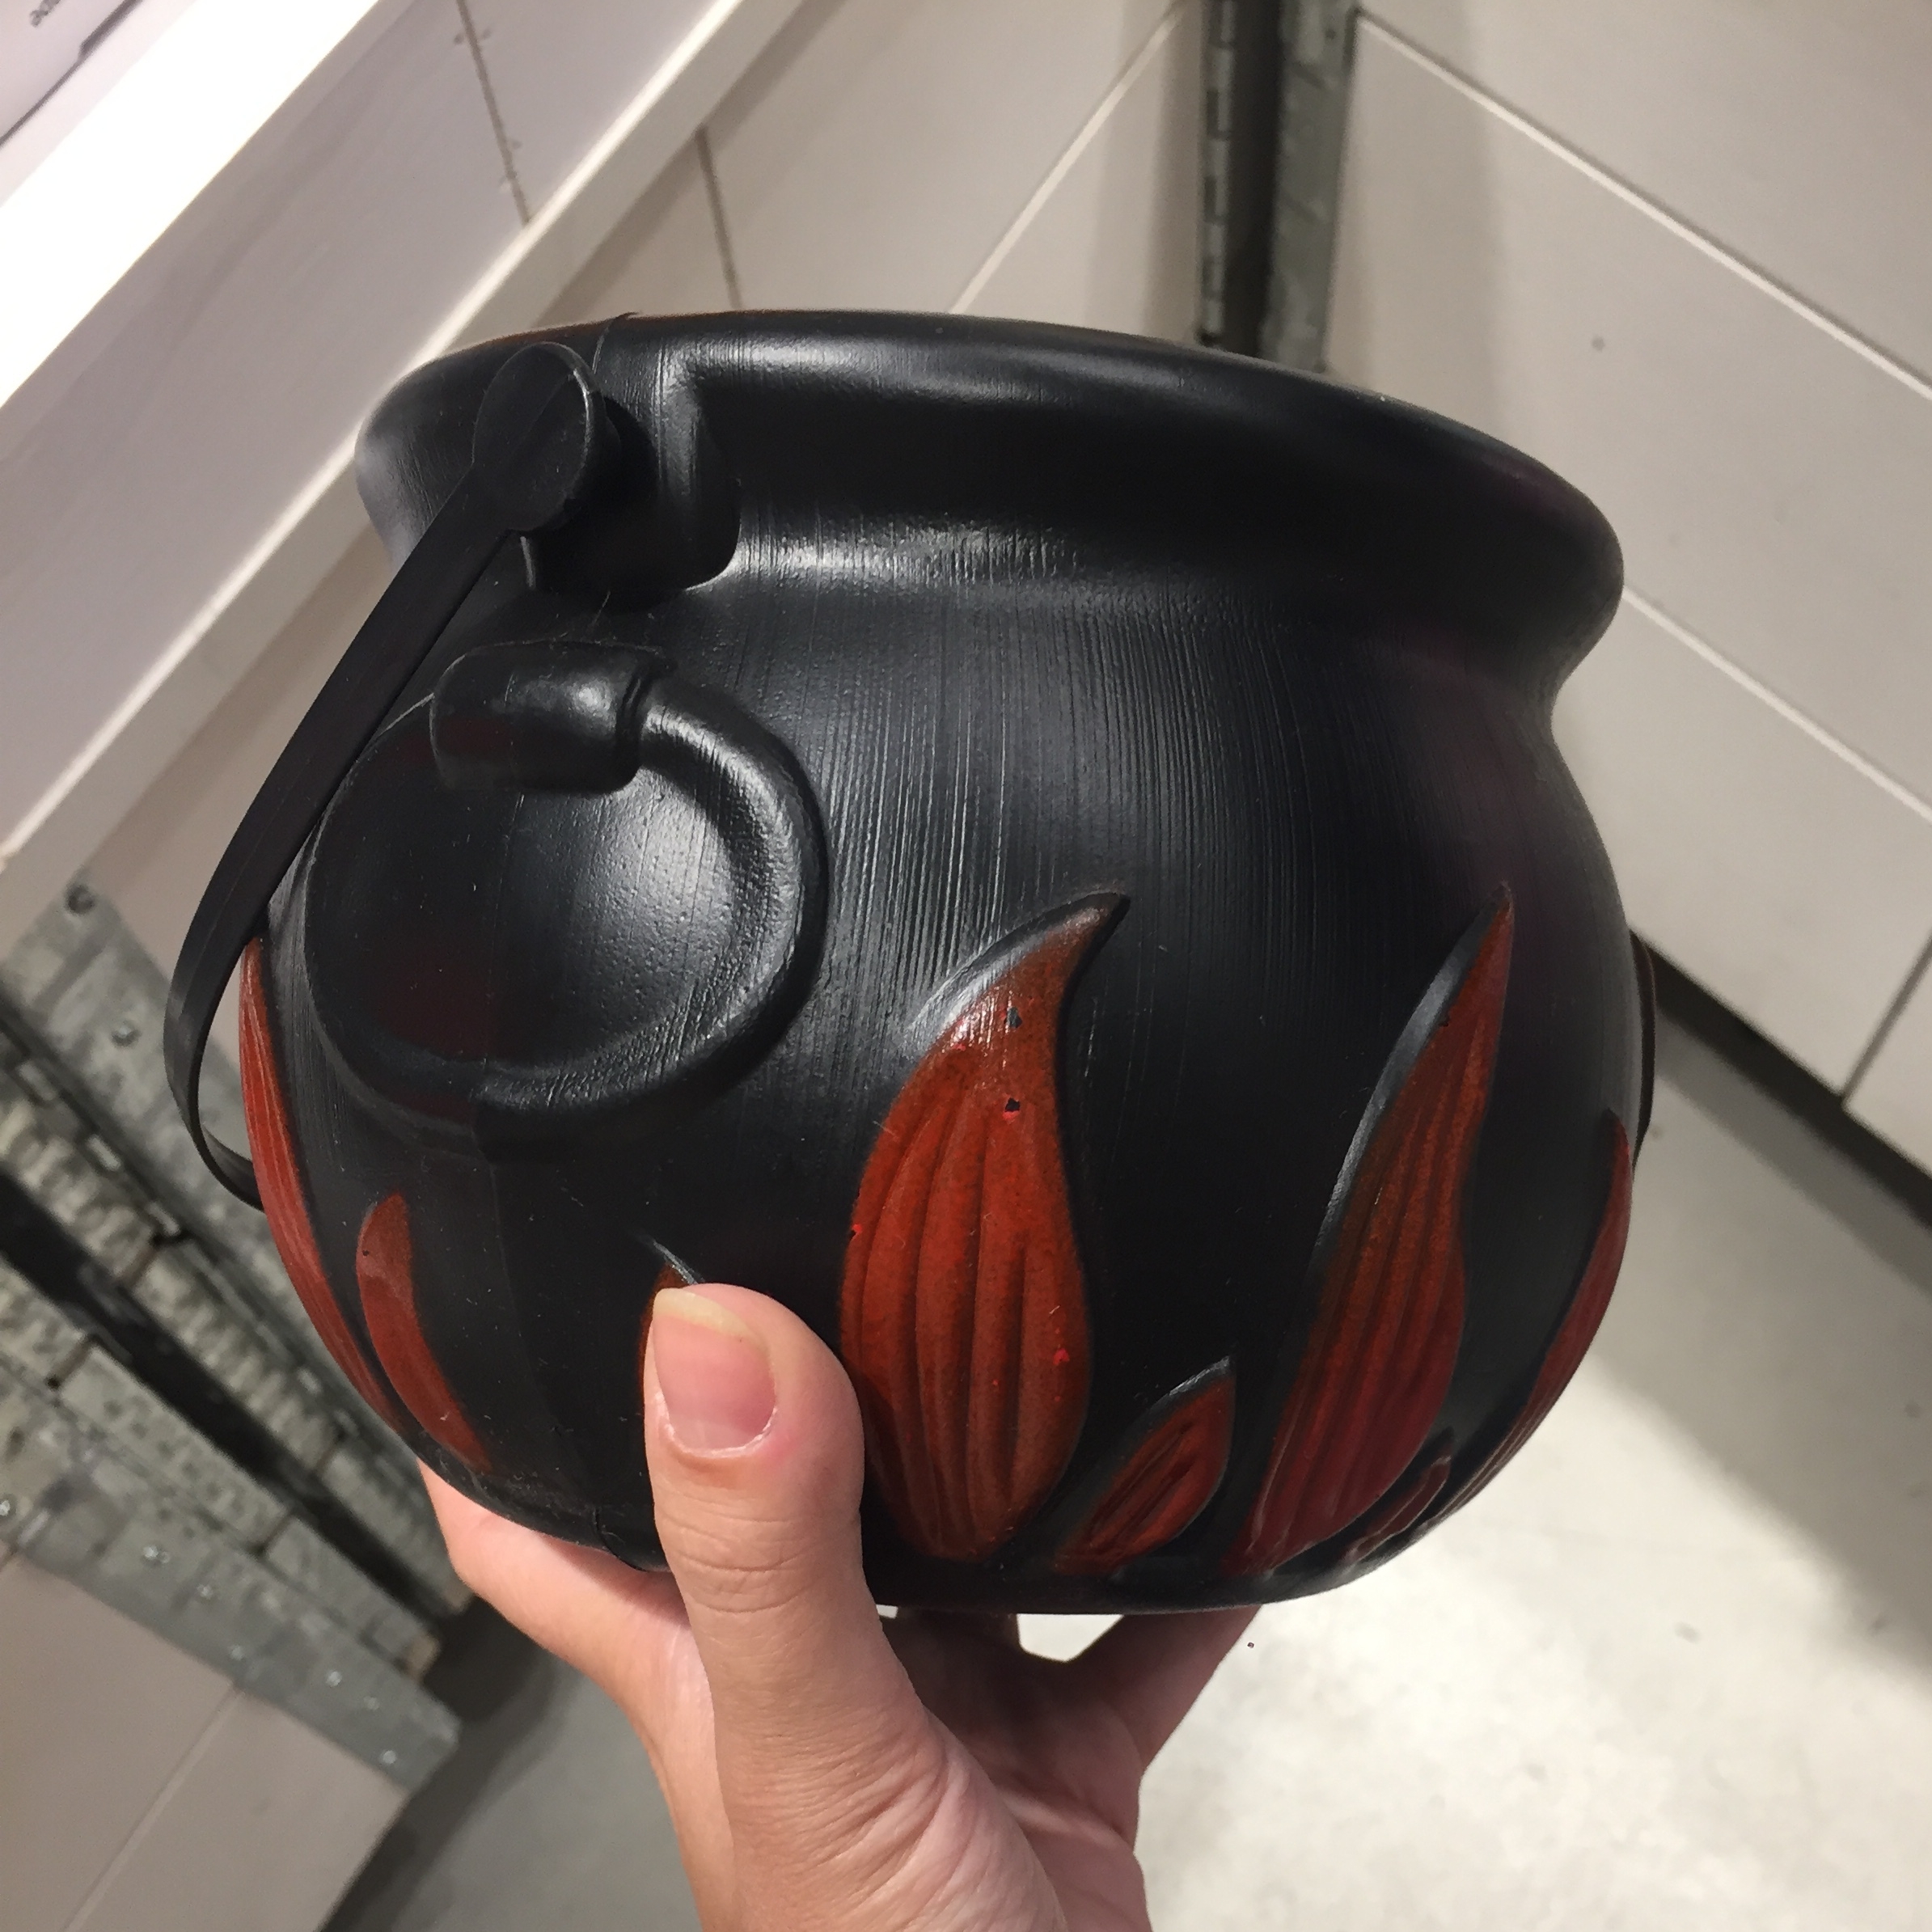
We started with a search for the jack o’lantern. We wanted a preexisting enclosure to save time. We settled on a plastic cauldron with a raised and painted flame design on the side.

Immediately, I disliked the way the flames were created on this cauldron, but I saw it as an opportunity to emphasize the future LEDs to be placed inside. I decided to cut out the flames, so that light could shine through, and since it’s a flickering candle in its normal state, this worked out nicely.

However, we didn’t want our shell to just have a bunch of flame-shaped holes, we would still need to enclose the LED bulbs inside, so we thought using some sort of translucent material would diffuse the light nicely. I tested with translucent acrylic and thought this could work well. We could laser cut the pieces and use some sort of plastic adhesive to hold it in place. But then, my dad has a genius suggestion and showed me a think translucent plastic that he used to use to diffuse light for photographic sets. This changed my path completely, the plastic was thinner, easier to cut and manipulate and I could paste it inside flush against the plastic.

Khensu-ra and I were also keen on adding a motor to our project. Originally, we planned to make the disco ball rotate. However, we quickly realized that this could be problematic with twisting all the wires inside. So we ditched this idea and thought what if we could make something come out of the cauldron! We became determined to create a fan that could blow confetti out of the top of the cauldron.

So the challenge had been set: we have a disco ball cauldron that’s sensitive to the environment, that lights up to the beat of the music, and blows confetti. HOW THE HECK DO WE BUILD THIS THING?

I sketched out a design that layered out components inside this cauldron. It was important to me that the final product would look very clean, but that we wouldn’t have to go crazy on cost.

IMG_2603.JPG

Description of sketch (from the bottom layer to the top):

  1. We wanted the first layer, so to speak, to be a box to enclose wires, the Arduino, and the fan battery. Luckily, I had scavenged this perforated metal box from earlier in the year. It had an open top though, so we would have to create some sort of lid. We ended up finding some left over acrylic to laser cut for this.
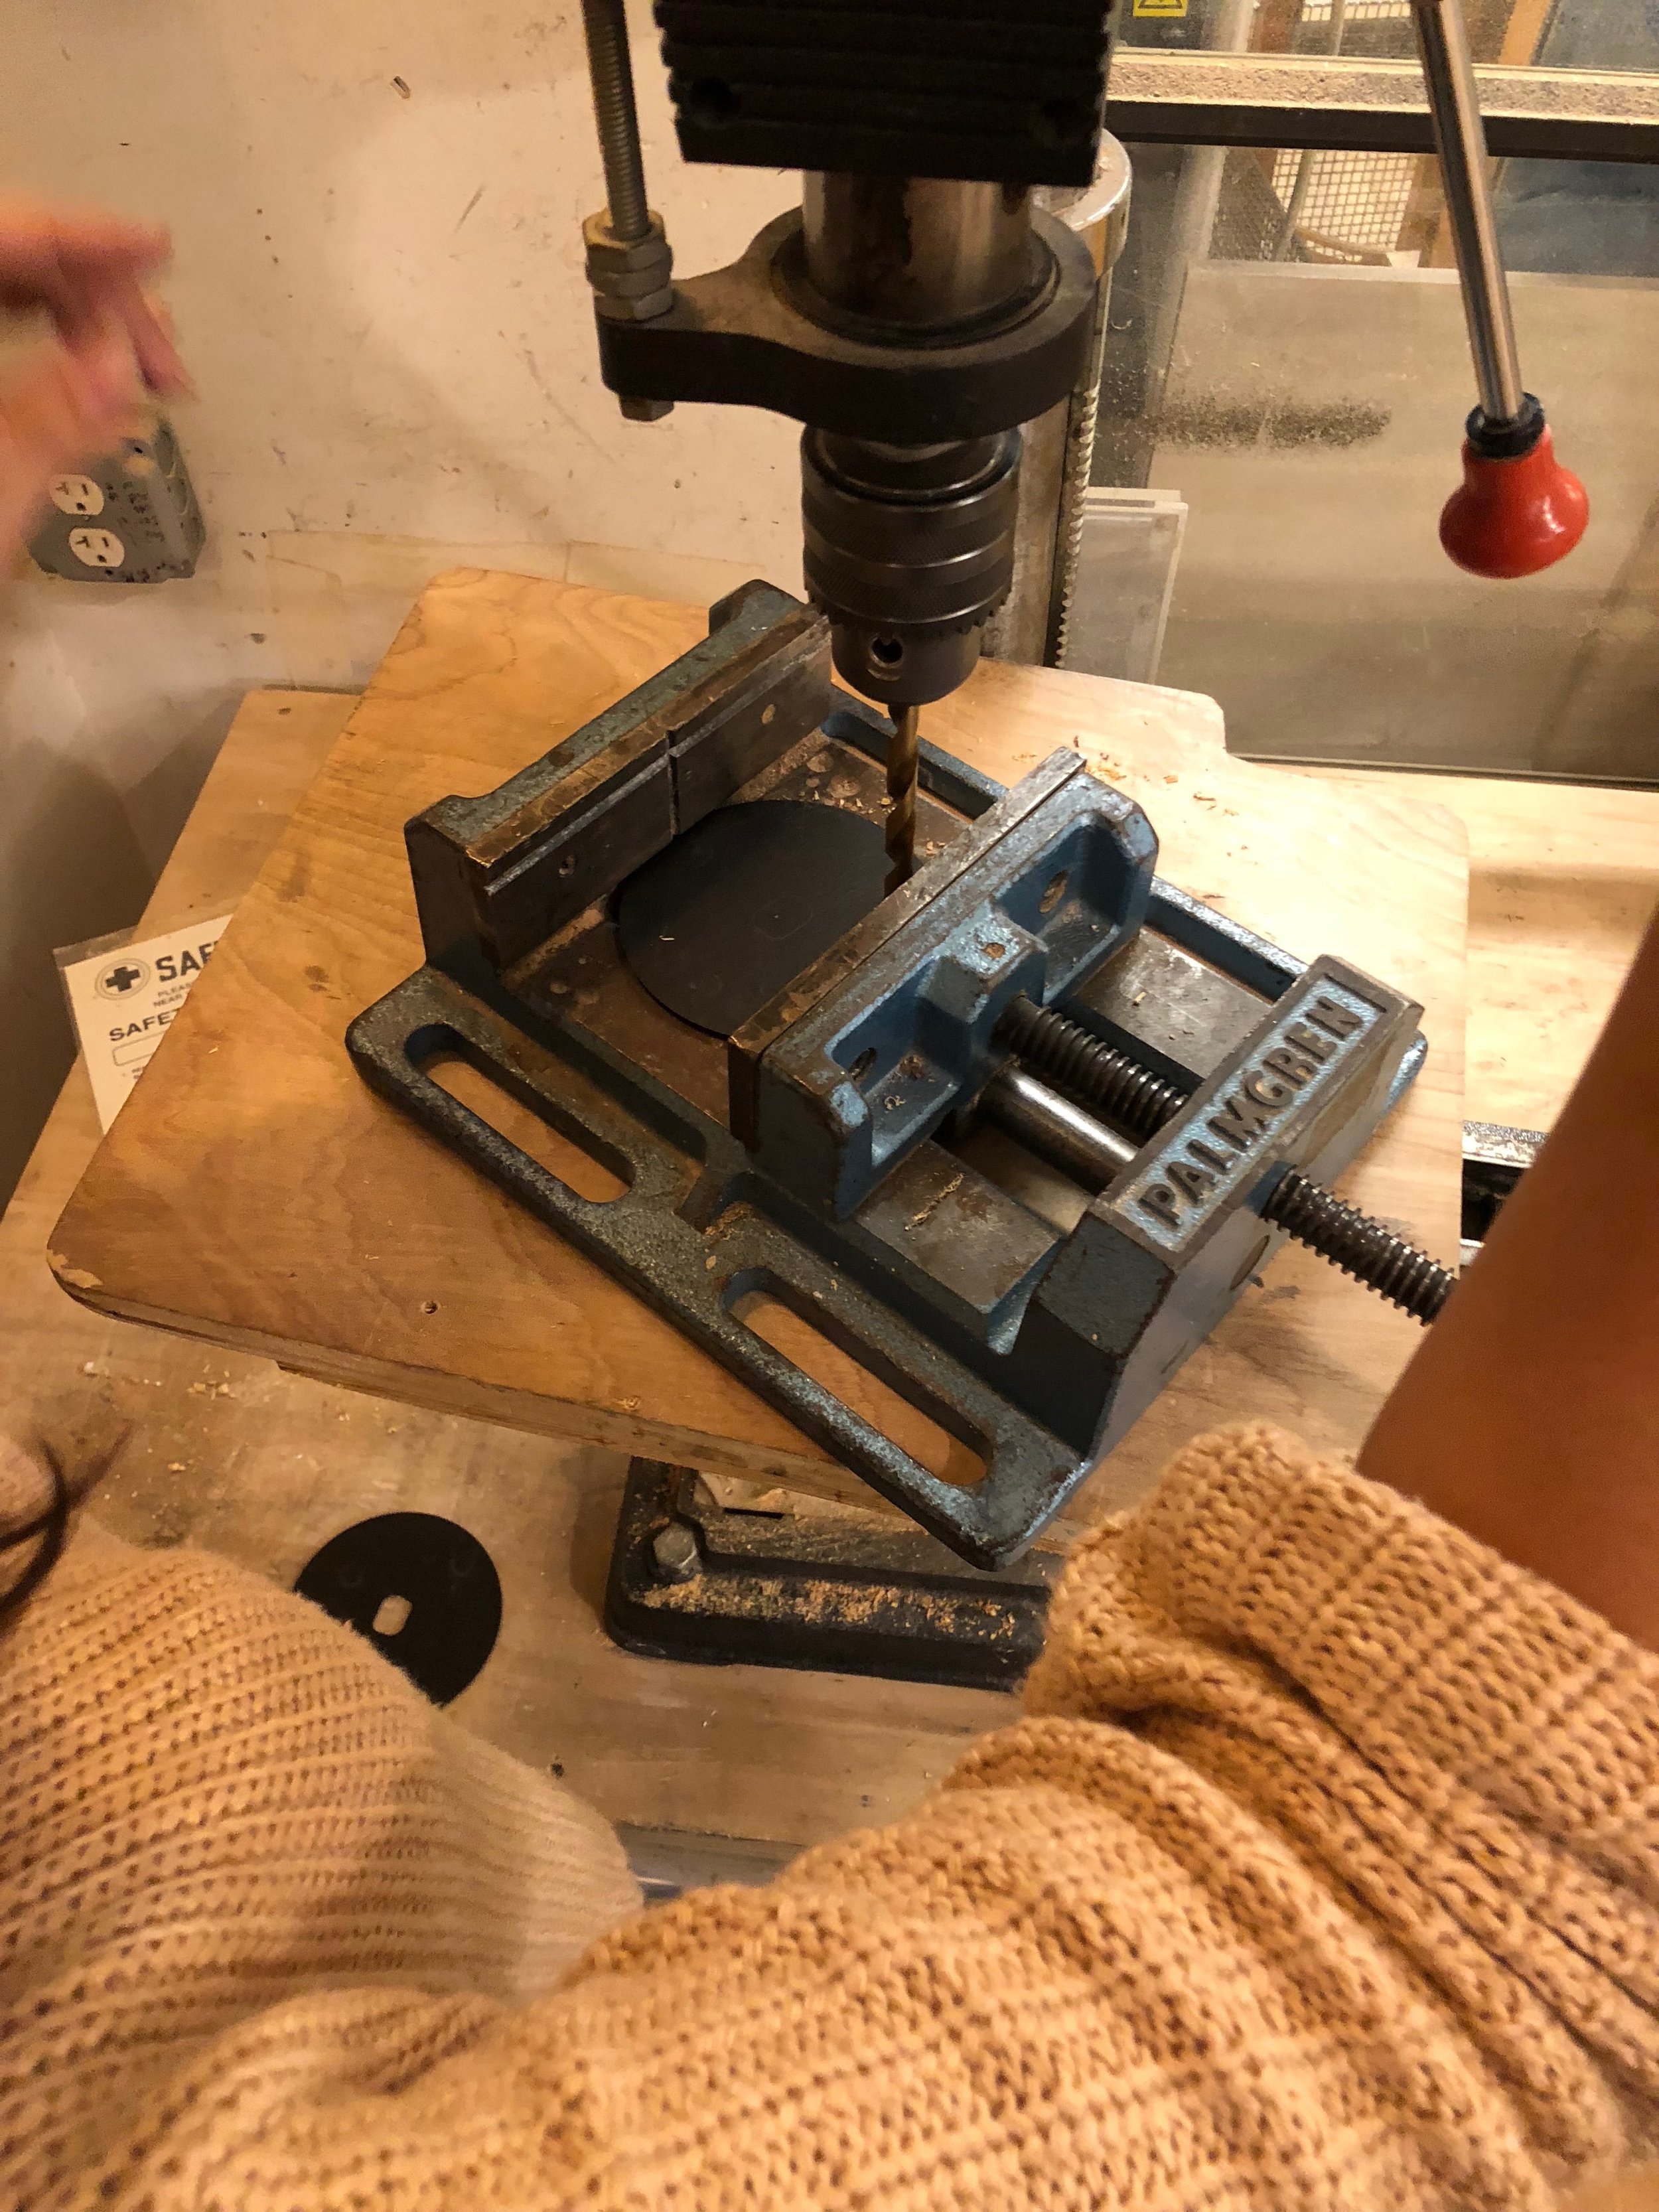
  2. We would drill holes in the four corners to attach to the box, a hole for the fan switch, 3 holes for the cauldron to be attached and one larger hole to run wires through.

  3. The cauldron would have the translucent plastic attached from the inside.

  4. Then, we would rest a small tower to hold the breadboard with LEDs at the bottom, and mount the motor for the fan on the next layer (made from two laser cut acrylic panels stacked with dowels).

  5. Drill a small hole on the edge of the cauldron lip to expose the photocell.

  6. Mesh layer on the top to rest confetti on top of.

So this became our task list, and in execution we accomplished each step pretty much to a tee, but it was certainly a challenge!

Creating the stacked interior tower:

We drilled into the acrylic to create a circular indentation that the dowels could fit into.

We drilled into the acrylic to create a circular indentation that the dowels could fit into.

Khensu-ra holding dowels and acrylic pieces together while the glue sets.

Khensu-ra holding dowels and acrylic pieces together while the glue sets.

Get that motor runnin’:

Creating the motor mechanism was an interesting part. Getting our motor to run was easy, but getting it to blow confetti was difficult. We were originally advised that we should use a tube where air could be underneath the fan, otherwise it wouldn’t blow anything. When we tried this, however, the motor created a vacuum and ended up pulling the confetti in the opposite way that we wanted. We tried enclosing the motor instead with a back to the tube. This worked, the confetti has nowhere to go but up and out!

Late night madness in the shop.

Late night madness in the shop.

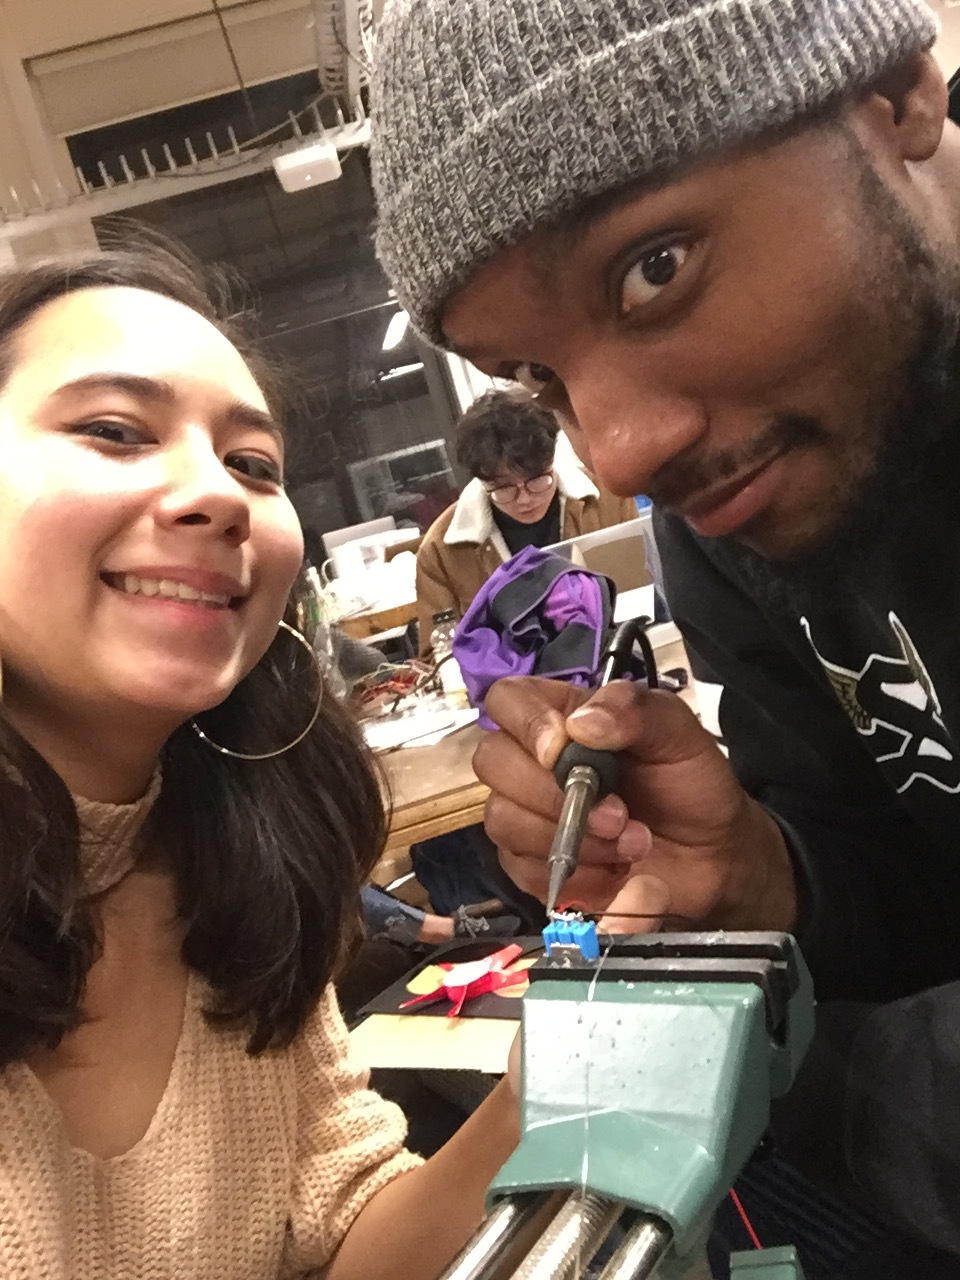
Soldering the motor switch.

Soldering the motor switch.

Motor mounted and spinning.

Motor mounted and spinning.

Fan blows confetti out of the tube. I celebrate every victory.

Fan blows confetti out of the tube. I celebrate every victory.

Of all these elements, which part do you think would have been the hardest to complete?

Well, whatever you thought, you’re wrong.

It was the DAMN LID for the box.

Surprised? Yea us too.

Khensu-ra and I measured this lid probably a million times, with electronic calibers even, to make sure all hold would be in the exact right place. Alas, we adjusted it over 7 times, mocked it out on cardboard about 6 times, and sadly the final acrylic piece still did not fit correctly. TRAGIC. Ashamed to say, I had to file out the four corner holes in desperate measures to make this thing sit on the box correctly. It worked out, but I’ll never forget the pain.

Found metal box to be used as the base of the cauldron and to enclosure the Arduino and battery.

Found metal box to be used as the base of the cauldron and to enclosure the Arduino and battery.

One of a million laser cut cardboard prototypes of this lid and that was even before the other holes were added.

One of a million laser cut cardboard prototypes of this lid and that was even before the other holes were added.

Final acrylic lid with holes. After all that it fit better having the switch in the opposite side of what we planned. Ugh the struggle, the sacrifices.

Final acrylic lid with holes. After all that it fit better having the switch in the opposite side of what we planned. Ugh the struggle, the sacrifices.

Another unpredicted issue was that the metal box was actually super conductive. I didn’t want to risk killing my Arduino, so I had to cover the whole inside with tape (and the bottom is cardboard) to make sure no wires or pins from the Arduino could touch the metal surface of the box. This solved the problem.

Glued transparent plastic for the flames, outside view.

Glued transparent plastic for the flames, outside view.

From this photo you can see how the photocell was mounted to the rim of the cauldron. The stacked tower placed inside. The translucent plastic for the flames was adhered by cutting it larger than the flame and glueing the edge around the opening.

From this photo you can see how the photocell was mounted to the rim of the cauldron. The stacked tower placed inside. The translucent plastic for the flames was adhered by cutting it larger than the flame and glueing the edge around the opening.

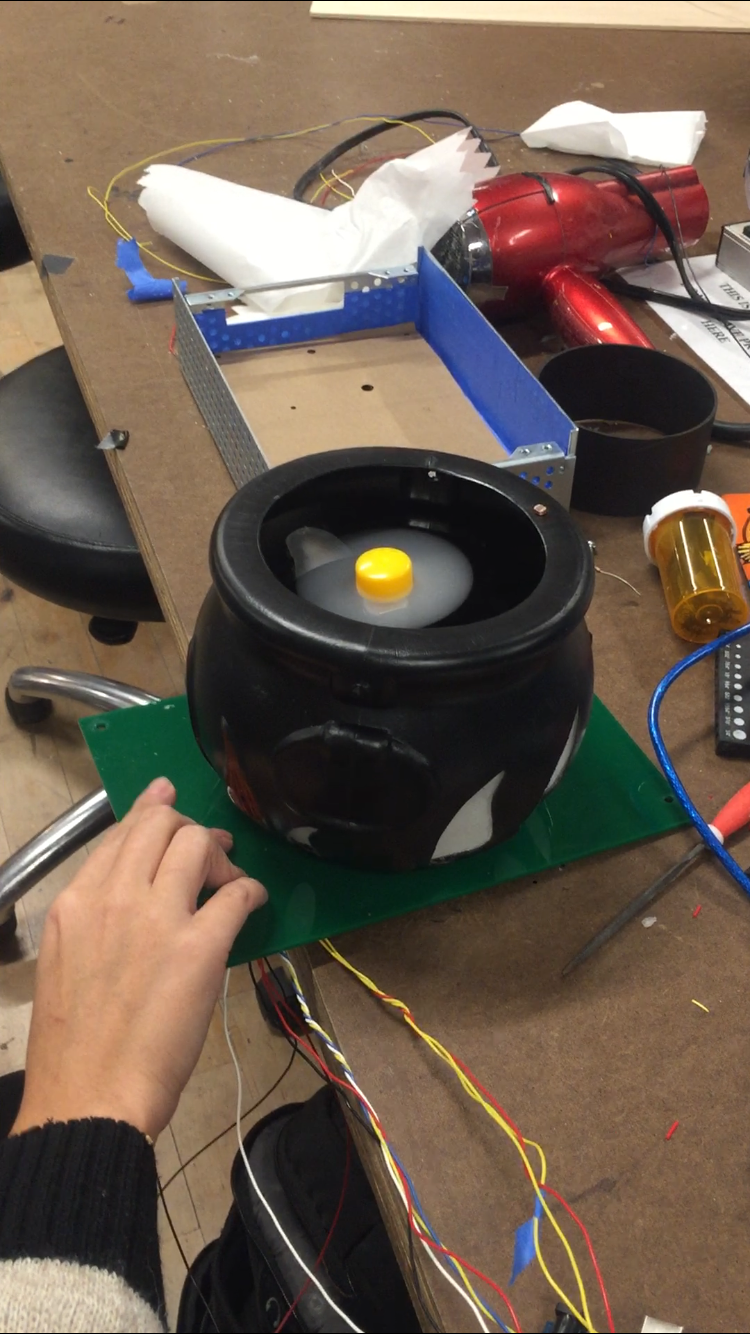
Pictured here is my finger on the fan switch with cords run through a hole in the green panel to be hidden in the box. Behind the cauldron is the metal box after being covered with blue tape and cardboard inside to prevent electrical shortage.

Pictured here is my finger on the fan switch with cords run through a hole in the green panel to be hidden in the box. Behind the cauldron is the metal box after being covered with blue tape and cardboard inside to prevent electrical shortage.

With all the code working, assembly seemed straight forward. The components worked, we just needed to put it inside this weird bowl. Our engineering of this device was actually quite sound, but all the movement of pieces, inevitably always made a wire or something pop out and left me quietly crying that the disco ball had suddenly stopped working. Ashley came to my rescue and said I could hot glue wires to the breadboard and it will help them stay in place. BLESS, this solved my issue entirely. As long as everything stayed connected, there would be no issue.

Shot of the final product.

Shot of the final product.

FINAL THOUGHTS:

Ultimately, the halloween disco cauldron was a success! I think people enjoyed how responsive the cauldron was to the light in the room. It was a simple interaction, but an effective one, because it’s reacting to environmental change. In the end, we ended up using a lot of found material and strategies that we had learned from Intro to Fab (yay!). In addition, I very much enjoyed watching people’s reaction when they flipped a switch and saw confetti blow out. It was also a hilarious instinct that everyone would quickly clean up the pieces and put them back in. If I could do it over, my one big change would be to use stronger brighter LEDs, this would make the party state even more pronounced. Overall, I am very proud of this piece. It is clean, well constructed, and gets the point across. But the most exciting part is that it has the potential to be scaled up. The foundation is there, so where could we take it next?

WEEK ONE: STOP MOTION ANIMATION by Maya Pruitt

For our very first assignment in Animation, we were asked to make a stop motion video for a length of 30 seconds. For those who don’t know, stop motion is the very core of animation. It is the idea that still photos that change presented in rapid succession create motion. It is a painstakingly arduous method, but the results can be truly amazing!

I worked with NunTansrisakul.

Inspired by these chocolate eyeballs, we really focused on turning an inanimate object into a character and telling a story with a beginning middle and end.

IMG_2663.JPG

Here are some sketches of our ideation.

IMG_2661.JPG
IMG_2664.JPG

We settled on centralizing our story around the theme of a the morning routine - how humans wake up, stretch, meet people, take a shower, etc. BUT what would that be like for a chocolate eyeball? We decided that the life of a chocolate eyeball is to get up and prepare for its death: to become hot chocolate for us evil human overlords.

Quick Storyboard

Quick Storyboard

We wanted to play with medium a little bit with this project. We wanted our character to have legs but didn’t necessarily want to physically build them. I thought drawing over the top of photographs would give it an added element and a true nod to traditional animation.

Here is a gif for proof of concept.

eyeball.gif

In preparation of our shoot, I painted the eyeballs just to give them a little more pop as well as devised the best strategy for how to shoot. We decided to do a top down view to more easily control the objects in the scene. We used a board to fake a table surface and even laid it flat when we wanted to change perspectives. The top down angle also made it easy to go overlay the images with drawing. I thought it was clever that we shot it this way because it gave us more control but still provides the illusion of a side view.

After drawing HUNDREDS of pairs of legs on these things, Nun expertly started piecing the images together in Premiere and editing the video. For us, sound was really crucial. We wanted to take mundane morning sounds like alarm clocks and yawns and put it in the context of this weird living eyeball. It creates a very familiar tone and suddenly this foreign object is relatable.

Original (top) vs. Painted (bottom)

Original (top) vs. Painted (bottom)

Set up

Set up

FINAL THOUGHTS:

We really paid attention to detail. Every sound effect was carefully chose. Even the title wiggles as per Nun’s request! We are proud of how it all came together. It’s amazing how transformative a bunch of photos and black lines can be. Of course there are always ways to improve or adjustments to be made, but we are pretty darn satisfied with this.

WEEK 8: SKETCHING WITH EXTERNAL MEDIA by Maya Pruitt

This week, I wanted to do something a little silly. Using microphone input and external images, I thought it would be kind of funny, if the user’s voice could move a mouth on an existing image.

I used the iconic meme legend himself, Mr. Bubz and gave him a human mouth, by loading different images into p5.js.

Creating microphone input, was surprisingly the easiest part of this project. Following Dan’s tutorial it was pretty straightforward creating a mic object, starting it, and retrieving the volume value by using getLevel(). These functions were similar to the FFT ones I used last week in that to analyze sound in a certain way, you need o create a specific p5 object from the sound library, initialize it (start vs. analyze) and then can used a more specific function to retrieve data (getEnergy() vs. getLevel()).

The challenge came in creating a realistic mouth to move to the volume of microphone input. I started by using an ellipse to represent the mouth, but I didn’t like how awkward it was. This led to uploading a second image and delving a little into the 3D modeling functions. I thought if I could map the mouth to an ellipse that would give me more control. I wasn’t sure if I could just use map() though, so a friend suggested texturizing an ellipse.

I only wanted the height of the mouth image to move to emulate opening and closing in a funny way, so I added the volume of the mc input to the height of the teeth image.

However, this distortion is really off and now the mouth seems to grow on an diagonal. I’m not sure what is causing this. Maybe there is an actual distortion function that would be better? How can I fix this?

Check out the sketch here.

WEEK SEVEN: DATA VISUALIZATION by Maya Pruitt

This week’s assignment was to create a sketch that uses an external data source.

For a while now, I wanted to create a visual that changes to the rhythm of music, so this seemed like the perfect opportunity to play with that.

Music is data.

An mp3 file compresses sound sequences into a digital format. If we parse through this sequence we can extract really interesting information. When we think of music, we can often break down the sounds we hear ourselves, the heavy deep notes are the bass, the higher notes are called treble, we can distinguish the sounds of different instruments versus vocals, etc.

My goal was to have my data visualization represent these different parts of a song and change with the song as it played. It is kind of an ode to the familiar visual of audio meters.

maxresdefault (6).jpg

By consulting the p5 sound API, there is a perfect function to parse through the data of an mp3 file: p5.FFT or Fast Fourier Transform. FFT is an algorithm that analyzes sound and can isolate individual audio frequencies.

In addition, the function getEnergy() returns the value of the energy/volume of a specific frequency. There are even 5 predefined frequency ranges: bass, lowMid, mid, highMid, and treble.

With FFT, fft.analyze(), and getEnergy() I could begin breaking down the parts of any given song. Place these functions in the draw() loop and they constantly break down and return frequency values as the song plays.

For the visualization part, I wanted to keep it simple. I used the values received from the predefined frequencies to determine the width and height of ellipses. The result is concentric circles (I love me some ripples) that grow and shrink as the song plays. Each frequency range is represented by a different color. It is quite mesmerizing.

Screen Shot 2018-10-23 at 1.30.37 AM.png

I placed the frequency values in order will bass being the outside circle and treble the inside, because the values of the frequency range increase as the notes get lower on the scale.

What’s really cool about this visualization, however, is that you don’t necessarily need to know anything about music to understand what’s happening. It’s kind of fun to focus in on a part of a song you hear and see what circle corresponds to it. To add a little more dynamics, I have the bass circle grow more intensely to emphasize the drops. Something about the synchronization of audio and visual is very appealing. I definitely want to look into some cog sci studies of why that is. Anyway, I digress, link to the sketch below.

Screen Shot 2018-10-23 at 1.32.26 AM.png

Ready to be hypnotized? Check it out here. SOUND ON!

WEEK SIX: FAB FINAL! by Maya Pruitt

Hard to believe it has already been half of a semester and this was my final project for Intro to Fabrication. It proved to be the most difficult one yet.

The assignment was to mount a motor. Sounds easy, but we hadn’t even learned about operating DC motors yet in Physical Computing, so we were starting a bit in the dark. Obviously, since this is a fabrication course, the focus is on the physical and less on the computing aspect of the project, but a beautifully crafted container seems pointless if its contents don’t work. Thus, I was determined to learn about motors, get one running, and tie it all together with fabrication.

This project really tested me, my time management, and my ability to improvise. It started off pretty rough, feeling like I hit a wall for inspiration. What was I going to make? I took apart a disc printer and other forgotten electronics from the junk shelf and ended up scavenging some motors! But it turned out that what I recovered were stepper motors, which seemed even more difficult to master in the weeks time.

Finally the idea came when thinking about the motor as a way to make a sort of continuous animation. The real life draw() function if you will! Reflecting on the lack of sleep ITPers get, I decided to bring to life the idea of counting sheep to fall asleep. I was especially inspired by automata like this one, that turn circular motion by a crank into different types of kinetics.

Sorry for the long introduction, here’s how I made a sheep jump over a fence.

Step One: Get your motor runnin’

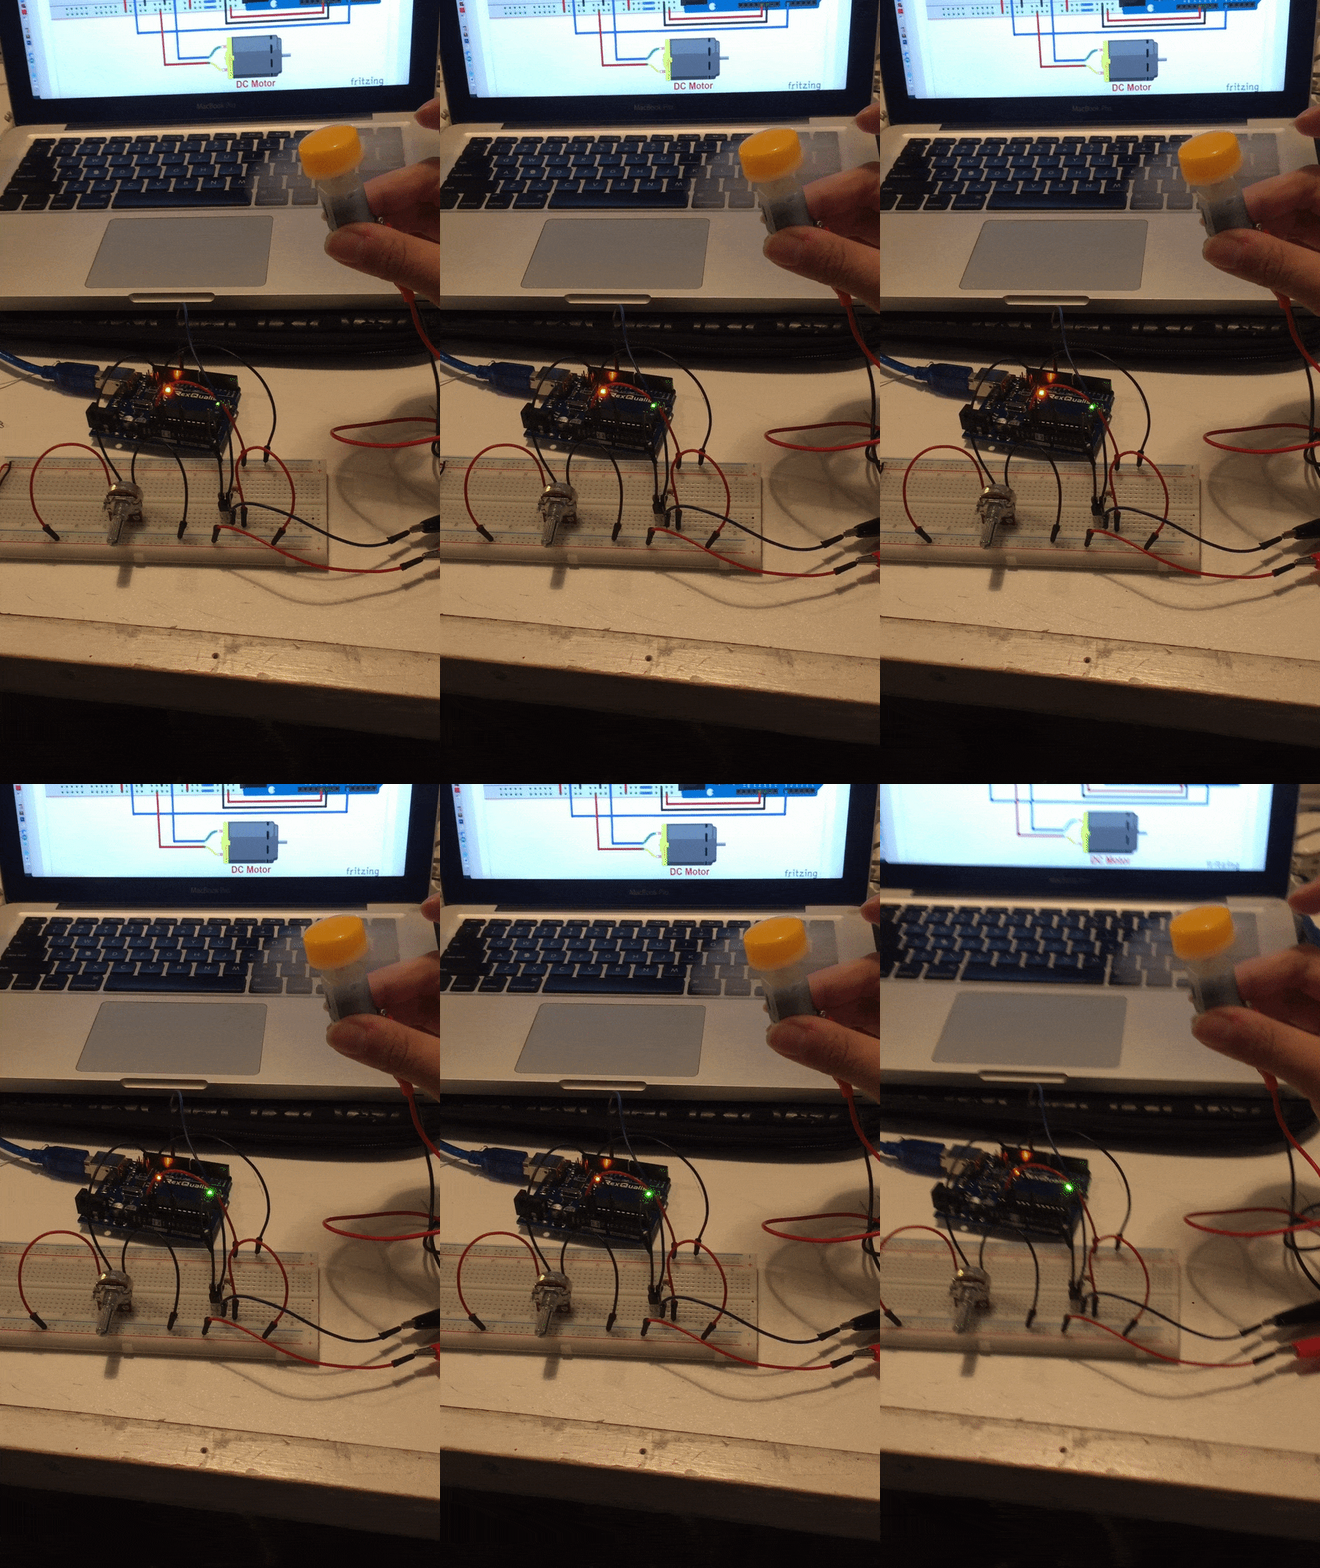
My first step was getting a motor running. Through a bunch of trial and error, an expensive trip to tinkersphere, and consultation with David Rios, I managed to hook up a dc motor to be powered only by an Arduino, and mapped to a potentiometer to control its speed. Upon David’s recommendation, I used a DC motor in a gear box to help slow the motor down. This was not only more suited for the movement I was looking for, but is also easier to mount! Yay, win win.

motor_fan.gif

Step two: prototyping

While I had made some sketches of how I would make my automata, it was hard to envision it until I started prototyping and making some things out of cardboard. During this stage, I figured out what kinds of elements I would need like a sheep, circular panels, and a fence. I drew these elements from scratch in illustrator for future laser cutting. I knew that if I put a disc on an axel attached to the motor it would spin like wheel. If I attached a stick from the disc it would also spin but with a wider radius and this would be what makes it looking like a jumping sheep. However, figuring out how to put it all in one piece was the challenge. I made a janky cardboard prototype to hash things out. I knew I should have two walls to put the axel horizontally between and the the motor could be mounted to the wall. I knew I would need wood if I were to have any stability.

IMG_2506.JPG
IMG_2483.JPG

Step 3: Cutting pieces

Luckily I had been stashing good pieces of scrap wood for a later project and had a good amount of material to work with. I figured out that I essentially needed to create a box,it didn’t have to be fully enclosed, but it needed to be tall enough or have enough room below the axel to have the sheep swing through without touching anything.

I laser cut a bunch of pieces, including the top of the “box”. While I prototyped with cardboard, I wanted to use of leftover acrylic for the sheep in order to try some other laser cutting techniques like engraving and the sharpie trick to color it! Acrylic would also be a little heavier which would help to slow down the movement.

IMG_2510.JPG
IMG_2509.JPG

Step 4: Assembly

This stage of the process always seems likes its going to be the simplest. You’ve finally figured out your idea, you’ve cut all your pieces, how hard could it be to put it all together? Answer: extremely.

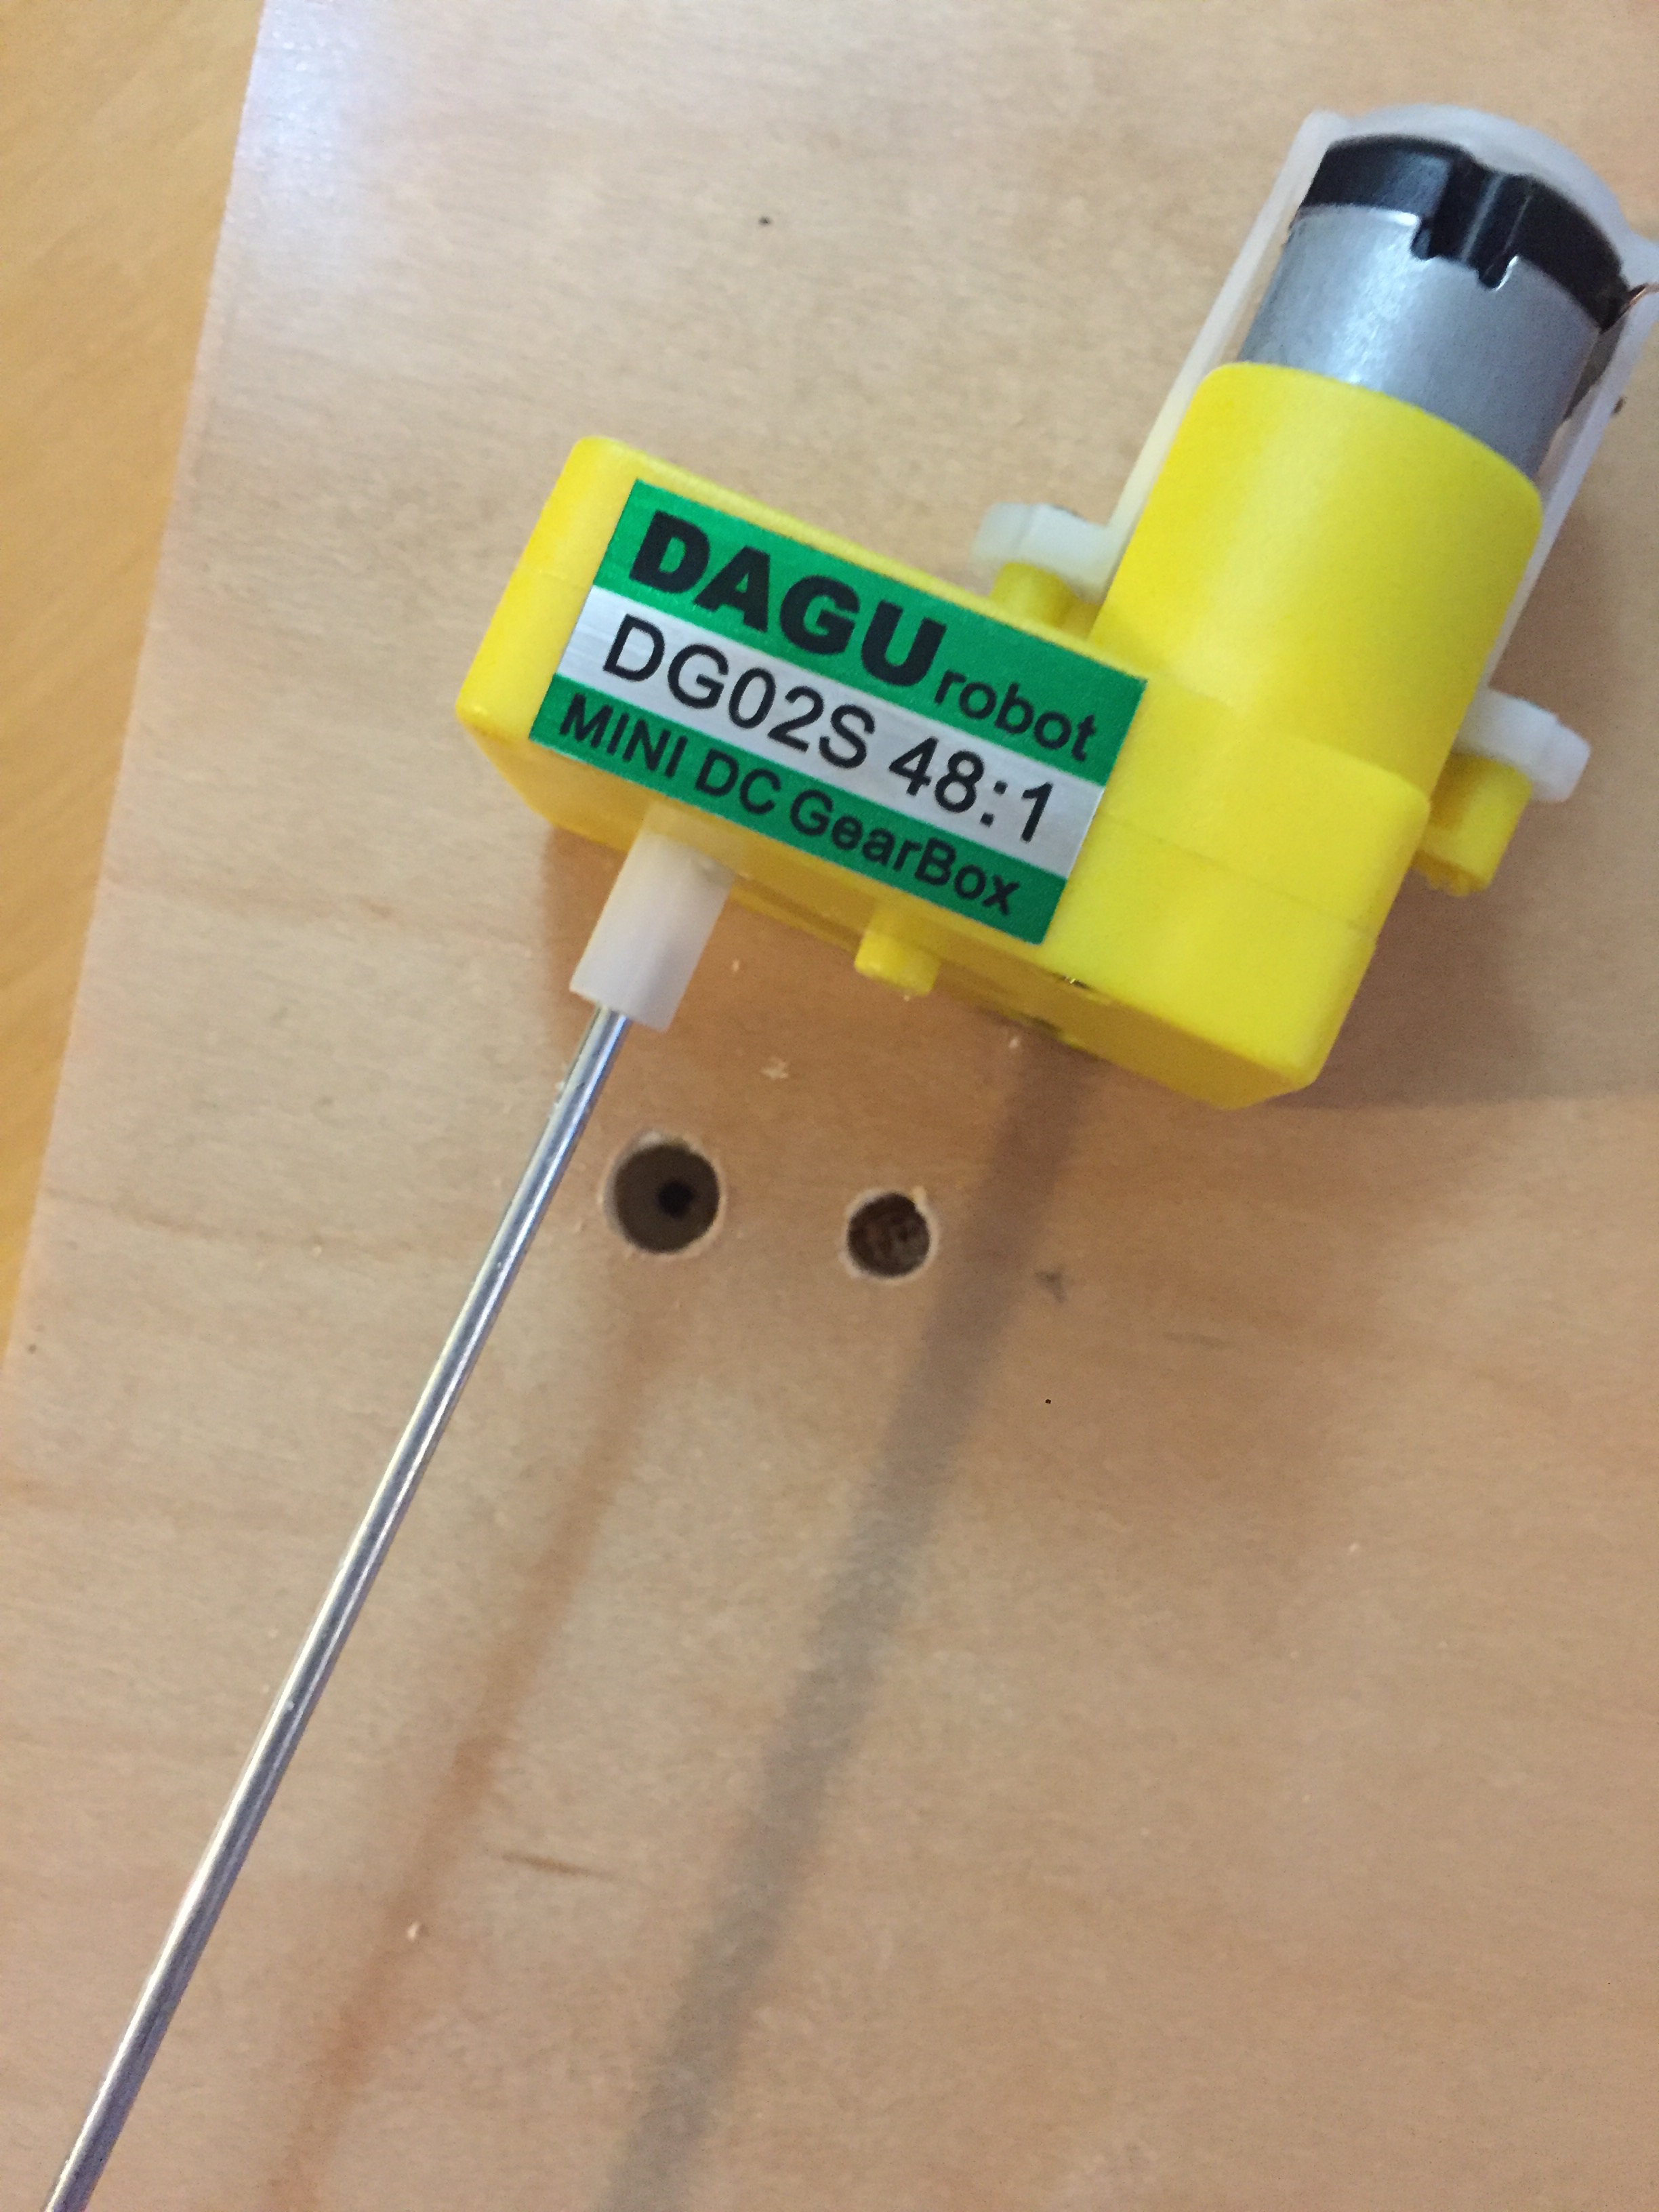
My wood was wonky, I didn’t plan how I would adhere anything, etc. I managed to glue the wood pieces together and screw them for extra support. I drilled holes for the axel rod to go through, the motor shaft, as well as a weird nub on it. This way the gear box would lie flesh to the wall.

IMG_2492.JPG
IMG_2485.JPG
IMG_2488.JPG
IMG_2484.JPG
IMG_2489.JPG
set up to drill.JPG
IMG_2495.JPG

In the process of testing my project, I ripped a lead off the motor. ABSOLUTE PANIC. But i figured out how to take a motor apart and replaced the leads for another pair from a different motor. Guess that trip to Tinkersphere wasn’t so bad after all (I bought backup motors for stupid things like this). If you ever destroy those flimsy leads off a motor, I GOTCHU.

With things back under control, I focused on the main aspect of this project, mounting that motor! I had to drill out holes to be bigger to make sure the axel and the plastic nub had more room. Just like my table, I discovered that plumbing supplies are quite useful. My dad had some plumbers strapping lying around (thanks Dad!), which is easily bendable. Voila! A homemade bracket!

IMG_2493.JPG
IMG_2497.JPG

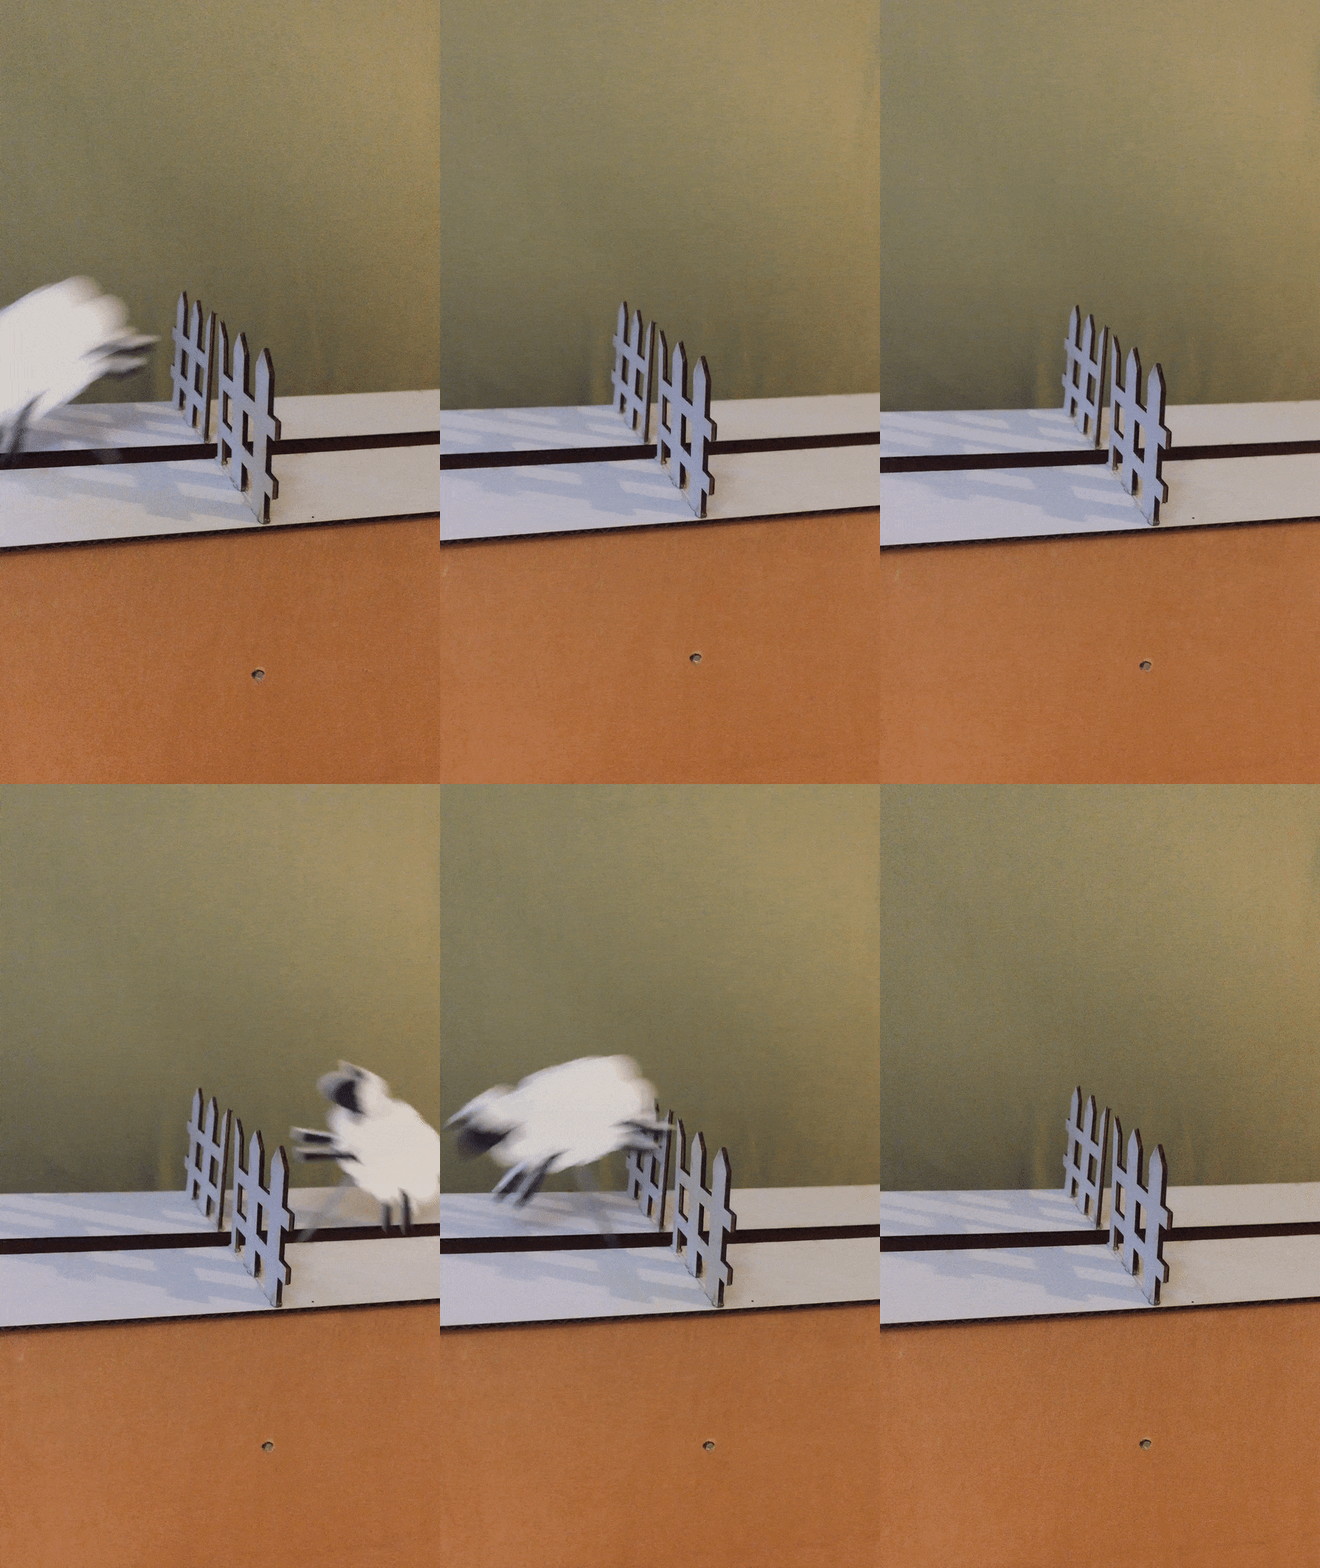
It took a long while to put the wheel and sheep onto the motored rod. It also took a whole lot of hot glue. But with persistence, I got everything running. With some final touches, like adding the fence, the sheep successfully jumps over the fence.

IMG_2487.JPG
jump_motor side.gif
IMG_2498.JPG

FINAL THOUGHTS:

There is definitely a lot I would do differently for this project. It felt very hap hazard the whole time, and I could have planned things out better. I would also like to make a version where the Arduino and breadboard could be enclosed. However, ultimately, I am quite proud of how it turned out. I combined a lot of skills I have learned throughout the course, and really learned how to improvise and adapt. It’s very exciting to make things work AND look fabulous. Cheers to a great course and hopefully getting my sleep back!

ezgif.com-optimize.gif

ok, time to count sheep. One, Two…..Zzzzzzz


WEEK SIX: THE DOM by Maya Pruitt

Usually I use my blog posts to describe my homework sketches, but I also need to air out some grievances. I found working with the developer tools on the New York Times home page to be extremely frustrating. On one hand it’s very empowering to make changes to an existing site and see it displayed in real time, but with so much content on the NYT site, I found google’s display of the developer tools to be overwhelming. I had a hard time figuring out what parts were even adjustable.

To Mimi, can we do a quick re-review of this and its parts? And maybe discuss the applications of the developer tools, why do programmers use that? What is its true purpose?

Now back to the fun part - this week’s sketch:

Our assignment was to create our own webpage using HTML, CSS, and P5 javascript. This was fun for me, because I got to start to bring to life a design I had done in the past. In the Graphic Design/UX section of my portfolio, you can see my design for ZODIAPP: an app about the Chinese Zodiac. I had sketched out the look of the app and even animated the types of interactions it could have. While there are tools like InDesign, that allow UX designers to prototype these interactions for user testing, it is a whole new world being able to actually create the code behind them. This assignment allowed me to do just that!

Original design

Original design

Translating into HTML

Translating into HTML

We had a few parameters to meet:

  1. Pre-defined HTML Elements

  2. Pre-defined CSS Styles

  3. HTML Elements generated by your p5 sketch

  4. Some kind of mouse interaction with an HTML Element using a callback function you write.

1. I used a bunch of pre-defined HTML elements, such as <div> <h3> and <font>. These elements allowed me to create the navigation bar at the top and gave me quite a bit of control. I could change the font color to white, as well as type the actual text to display. H3 gave me a default size that I liked best. Fun fact: spaces won’t change the way text displays. If you want actual white space, say in between each phrase in a navigation bar, you can use the special characters “&nbsp”.

<img id="logo" src="zodiapp_logo.png" />
<div id="navbar">
  <h3> <font color="white"> Horoscope &nbsp &nbsp &nbsp Story of the Zodiac &nbsp &nbsp &nbsp Animal Gallery &nbsp &nbsp &nbsp 2018</font>
  </h3>
</div>

(lines 11-15 in index.html)

I also used the predefined <img> element to load my logo image.

2. CSS styles allowed me to give properties to the HTML elements I created. For example, this is where I could give the navigation bar its background color and center align the text. In addition, I could modify the logo image. I learned a cool trick that if you want to adjust the scale of an image, you can set one dimension to a specific value and then the other dimension to “auto”. This will maintain the original dimensions of the image and prevent any weird stretching. Lastly, I set the entire background color of my webpage here.

html, body {
  margin: 0;
  padding: 0;
  background-color: #f9f4d9;
}

#logo{
  width:200px;
  height:auto; 
  /* auto keeps the dimensions of the original image*/
}

#navbar{
  background-color: gray;
  text-align: center;
}

(lines 1-16 in style.css)

3. It is also possible to create HTML elements within p5 itself, which allows for a whole different set of controls. It makes sense to generate HTML elements with p5 if you want to manipulate them in some way, so createButton() seemed perfect for this. In addition, I created the footer in p5. I thought this would give me more control for customizing the div element, but I couldn’t figure it out as easily as I did the HTML way. However, in the future if I wanted to create rollover (mouseOver() / mouseOut) events with the navigation bar and footer, say highlighting each word to a different color to indicate a link, maybe p5 would be the best place to create these elements.

  let button = createButton("SPIN");
  button.position(20,110);
  
  let footer = createDiv("About | Help | Contact Us");
  footer.position(275, 850);

(lines 12-16 in sketch.js)

4. Creating the mouse interaction was my favorite part because making a wheel of zodiac animals spin has been a part of my concept for this since day one. My goal was to have the wheel spin when the mouse clicked on the button. Here is where javascript ties it all together and puts an animated element on the webpage. I uploaded another image into the sketch.js file using the preload() function. I created a function called spin() which creates the spinning behavior. In order to get the button working correctly, I had to create a toggle switch, like we learned with the bouncing ball. This was stored in another function called spinOn(). The button can then use mousePressed to callback to the spinOn() switch function. Ideally I wanted this to look more like: wheel.spin() and button.mousePressed(spin), but I couldn't get it working like that. Would I need to create a wheel class? I’m pretty sure I could make a class for the wheel image and turn it into an object. It would be fun to expand on this in the future to make it more dynamic.

zodiapp_hw_html.gif
428px-DOM-model.svg.png

Oh, also to my non-ITP readers, in case you were wondering, DOM stands for The Document Object Model. It’s a kind of hierarchal way of organizing website programing/HTML . But to me “The DOM” sounds like a fancy ass queen, which is why it seemed like a sufficient title. k Yamz out.

Try dat spin button for yourself here.

PCOMP MIDTERM MEETS HALLOWEEN by Maya Pruitt

Perfectly timed with Halloween, it was only fitting that our Physical Computing midterm would be something interactive with this theme. For this project I worked with Khensu-Ra Love El (check out his blog here).

Rather than a likely spooky scary approach, we decided to do something fun and make a Halloween Disco Ball! This post documents the process.

When coming up with ideas we talked about different sensors we wanted to try, as well as how we wanted people to interact with our project. I really wanted to use a photocell resistor in this project, which is a sensor that measures light. I loved the idea of creating two states with our project, how would exist by day versus night?

My main idea was to have the photoresistor set to a threshold to know when it is dark in a room. Darkness would trigger different party lights. Khensu-ra also liked the idea of adding music, which I was definitely on board with. This became a really great way to include serial communication to Javascript since we were motivated to use actual mp3 files, not just robotic tones on the Arduino. Specifically, I had to have this thing play Thriller!

We decided to create two states, one in light and one in darkness - an ode to Halloween as a celebration of creatures of the night. Initially we thought of doing a Jack-o-lantern looking enclosure. We imagined that in the light state, the lantern would flicker like a candle and in darkness it would light up in different colors. Kind of a fusion of the images below:

Jack-o-27-Lantern-300x2661.jpg
disco-ball-8292-p.jpg

Creating the flickering candle effect seemed like a good place to start. Referencing this code, the Arduino and LEDs create a convincing candle light effect, especially when placed behind a translucent material (a sheet of paper in the video below).

flicker_candleEffect.gif

To create the trigger of light to dark, we decided to use a photocell resistor, which measures light. Even though it’s tiny, it’s quite sensitive. On the breadboard, I added more LEDs and figured out a threshold for the photocell. If the photocell is above a certain threshold value: enter candle state, if the value is below the threshold: enter part state.

partylights.gif

After creating these two initial states, we met with our Professor David Rios to figure out how to play music beyond Arduino tones. This proved to be a good opportunity to try serial communication. p5.js could read incoming photocell value readings and play music accordingly. We decided that turning the lights out in a room would also trigger the music playing.

It took us quite a bit of logic to figure out how to write the code for this. We needed our discoball to be aware of its state. It needed to recognize that it was both below the darkness threshold as well as know if it had already begun playing music.

function gotData() {
  photoVal = serial.read();
  if (photoVal < threshold && isDark == false) {
    song.play();
    isDark = true;
  }
  if (photoVal > threshold && isDark == true) {
    song.pause();
    isDark = false;
  }
}

Function gotData() reads the incoming photocell value from the Arduino and plays music when conditions of the if statements are met.

The result is a pretty sensitive system:

To make the lights more responsive and interesting, I wanted them to pulse to the beat of the music. I thought this would add more drama to our disco ball. I explored audio frequency visualization first in p5.js (see code for that here). The next step was to add serial communication again, but now going the other way, to have p5.js send instructions to Arduino (serial out). The beauty of this is that the code for my ICM beat visualization remains the same, p5 can use FFT to parse through the music, it then sends out a bunch of serial.write() commands that the Arduino then reads to light the LEDs accordingly. Below is a video of this first test with a single LED mapped to the bass of the song.

Then I added two more LED to indicate bass, midvalue, and treble! [video]